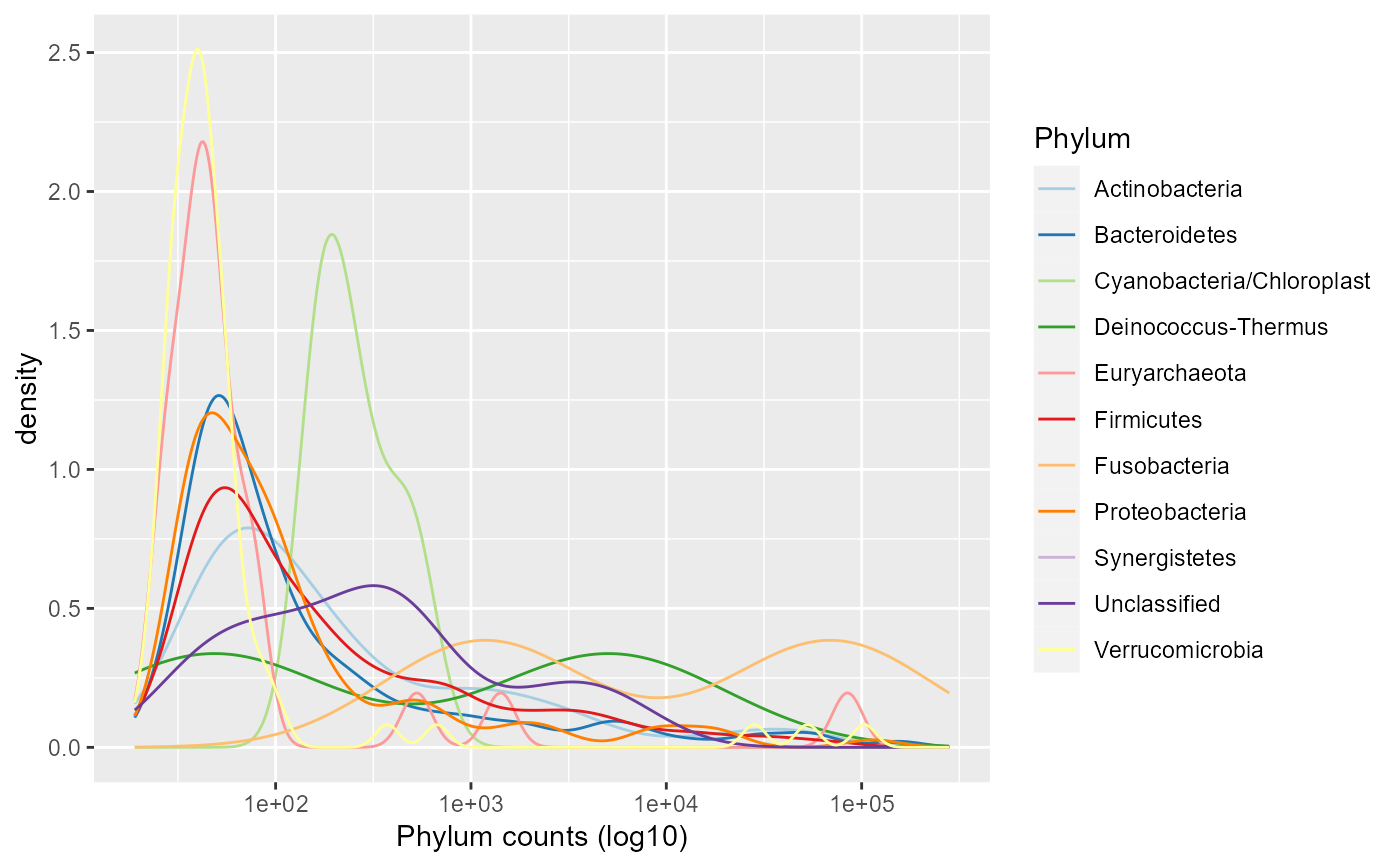
Plots distribution of taxa.
taxa_distribution(
  x,
  color.level = "Phylum",
  color.taxa = brewer.pal(12, "Paired")
)
Arguments
- x
phyloseq-classobject- color.level
Taxonomic level to color
- color.taxa
vector of colors specified by user Default is brewer.pal(12,"Paired")
Value
ggplot2 object
