Plot heatmap using phyloseq-class object as input.
plot_taxa_heatmap(
  x,
  subset.top,
  transformation,
  VariableA,
  heatcolors = NULL,
  ...
)
Arguments
- x
phyloseq-classobject.- subset.top
either NA or number of Top OTUs to use for plotting.
- transformation
either 'log10', 'clr','Z', 'compositional', or NA
- VariableA
main variable of Interest.
- heatcolors
is the option for colors in
pheatmap. Default is to use Spectral- ...
Arguments to be passed
pheatmap.
Value
A pheatmap plot object.
Examples
library(microbiomeutilities)
library(viridis)
#> Loading required package: viridisLite
library(RColorBrewer)
data("zackular2014")
ps0 <- zackular2014
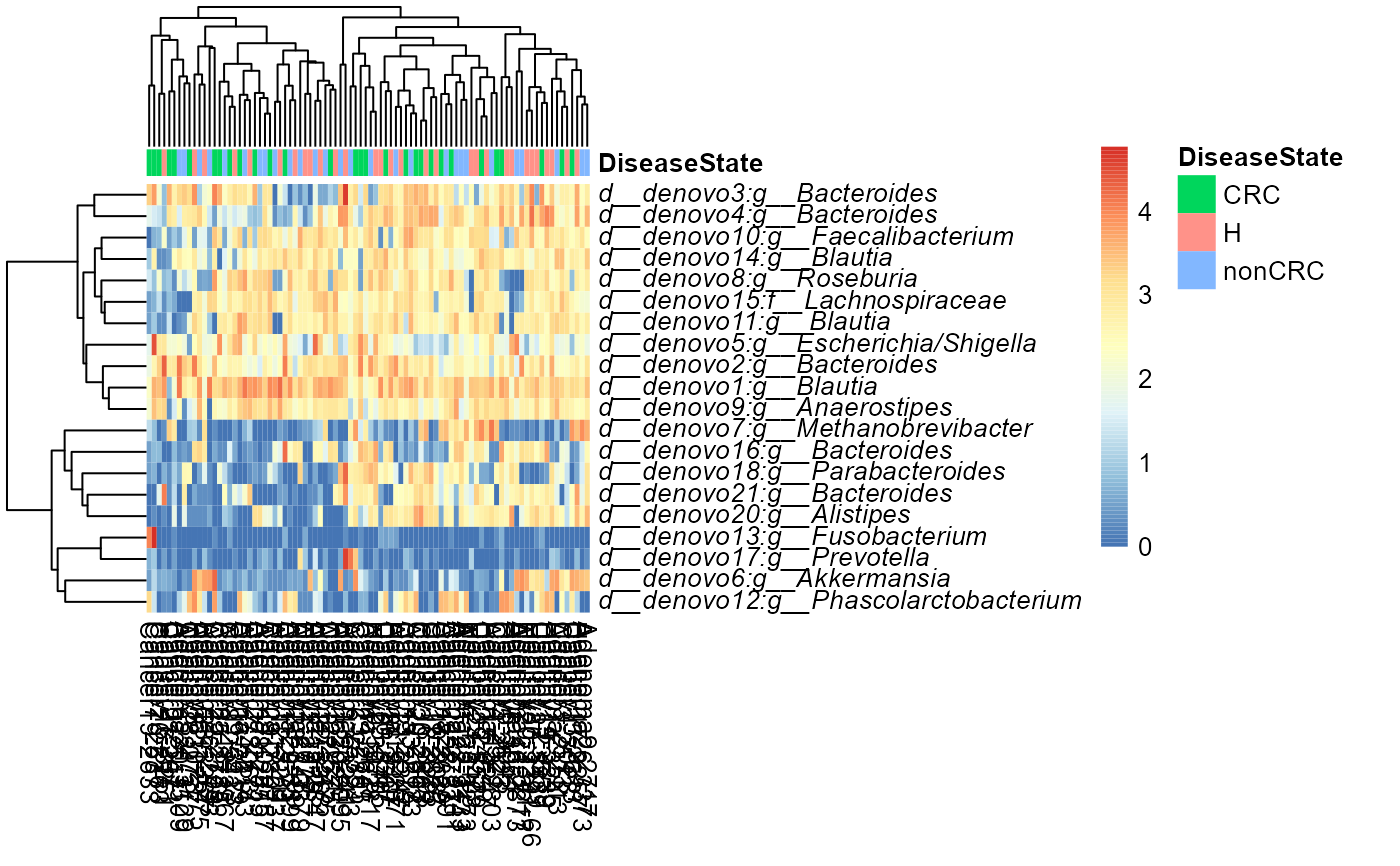
heat.sample <- plot_taxa_heatmap(ps0,
subset.top = 20,
VariableA = "DiseaseState",
heatcolors = colorRampPalette(rev(brewer.pal(n = 7, name = "RdYlBu")))(100),
transformation = "log10"
)
#> Top 20 OTUs selected
#> log10, if zeros in data then log10(1+x) will be used
#> First top taxa were selected and
#> then abundances tranformed to log10(1+X)
#> Warning: OTU table contains zeroes. Using log10(1 + x) transform.