Creat a plot for alpha diversities calculated using the microbiome package
Source: R/plot_alpha_diversities.R
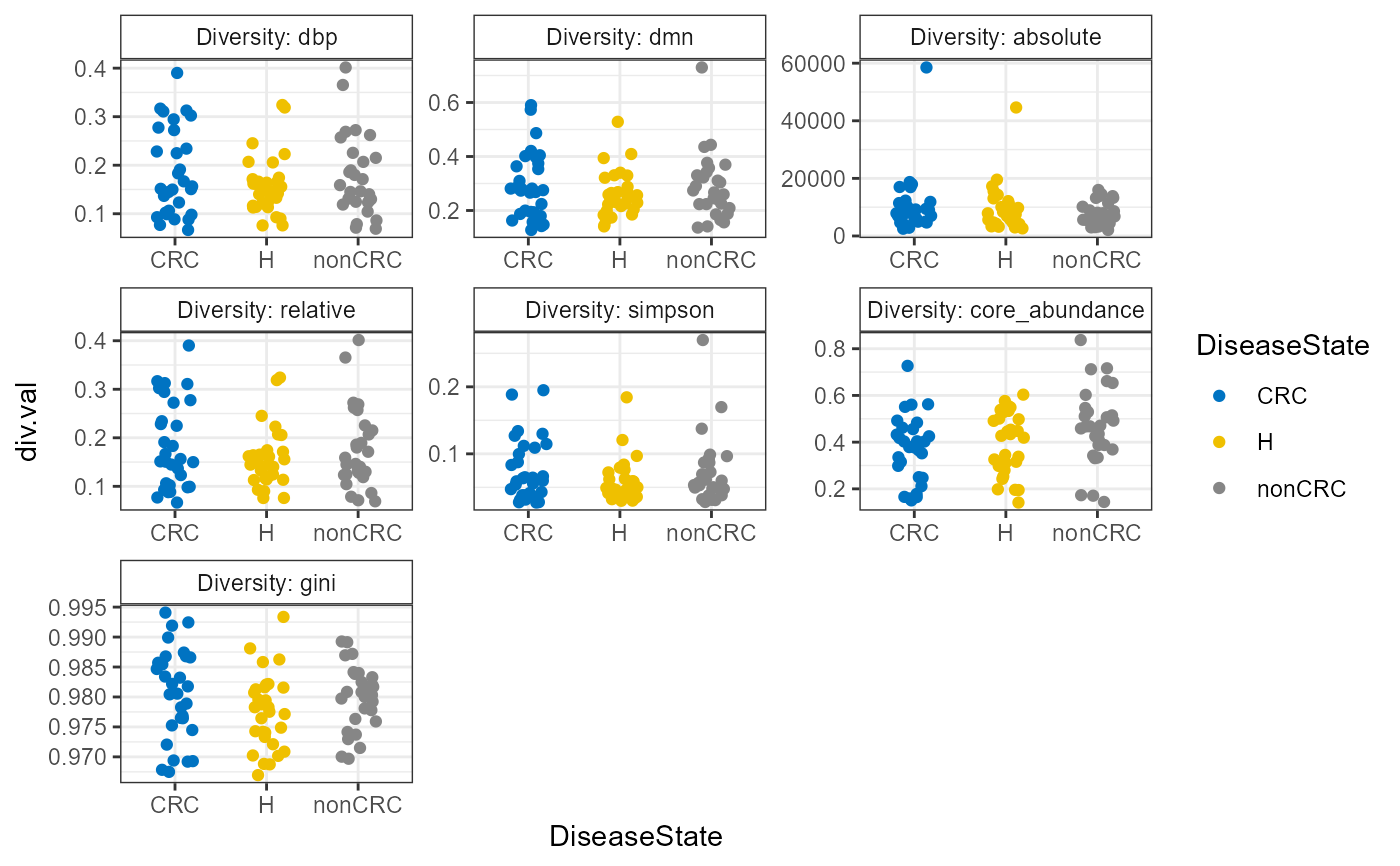
plot_alpha_diversities.RdUtility plot function for diversity measures calcualted by microbiome package.
plot_alpha_diversities(
  x,
  type,
  index.val = "all",
  plot.type,
  variableA,
  palette
)
Arguments
- x
phyloseq-classobject.- type
Either alpha (Diversity Index) or dominance (Dominance Index) or evenness (Evenness Index)
- index.val
see global function in
microbiomepackage- plot.type
Three optons c("stripchart", "boxplot", "violin")
- variableA
Variable of interested to be checked. This will also be used to color the plot
- palette
Any of the
RColorBrewerplettes
Value
ggplot object. This can be further modified using ggpubr
Details
Uses the microbiome package global function to calculate diversities and then returns
a plot.
Examples
library(microbiome)
library(microbiomeutilities)
data("zackular2014")
p0 <- zackular2014
p <- plot_alpha_diversities(p0,
  type = "dominance",
  index.val = "all",
  plot.type = "stripchart",
  variableA = "DiseaseState",
  palette = "jco"
)
#> Using sam_rep_nw as id variables
#> Using investigation_type, project_name, DiseaseState, body_product, FOBT.result, material, sam_rep_nw as id variables

print(p)