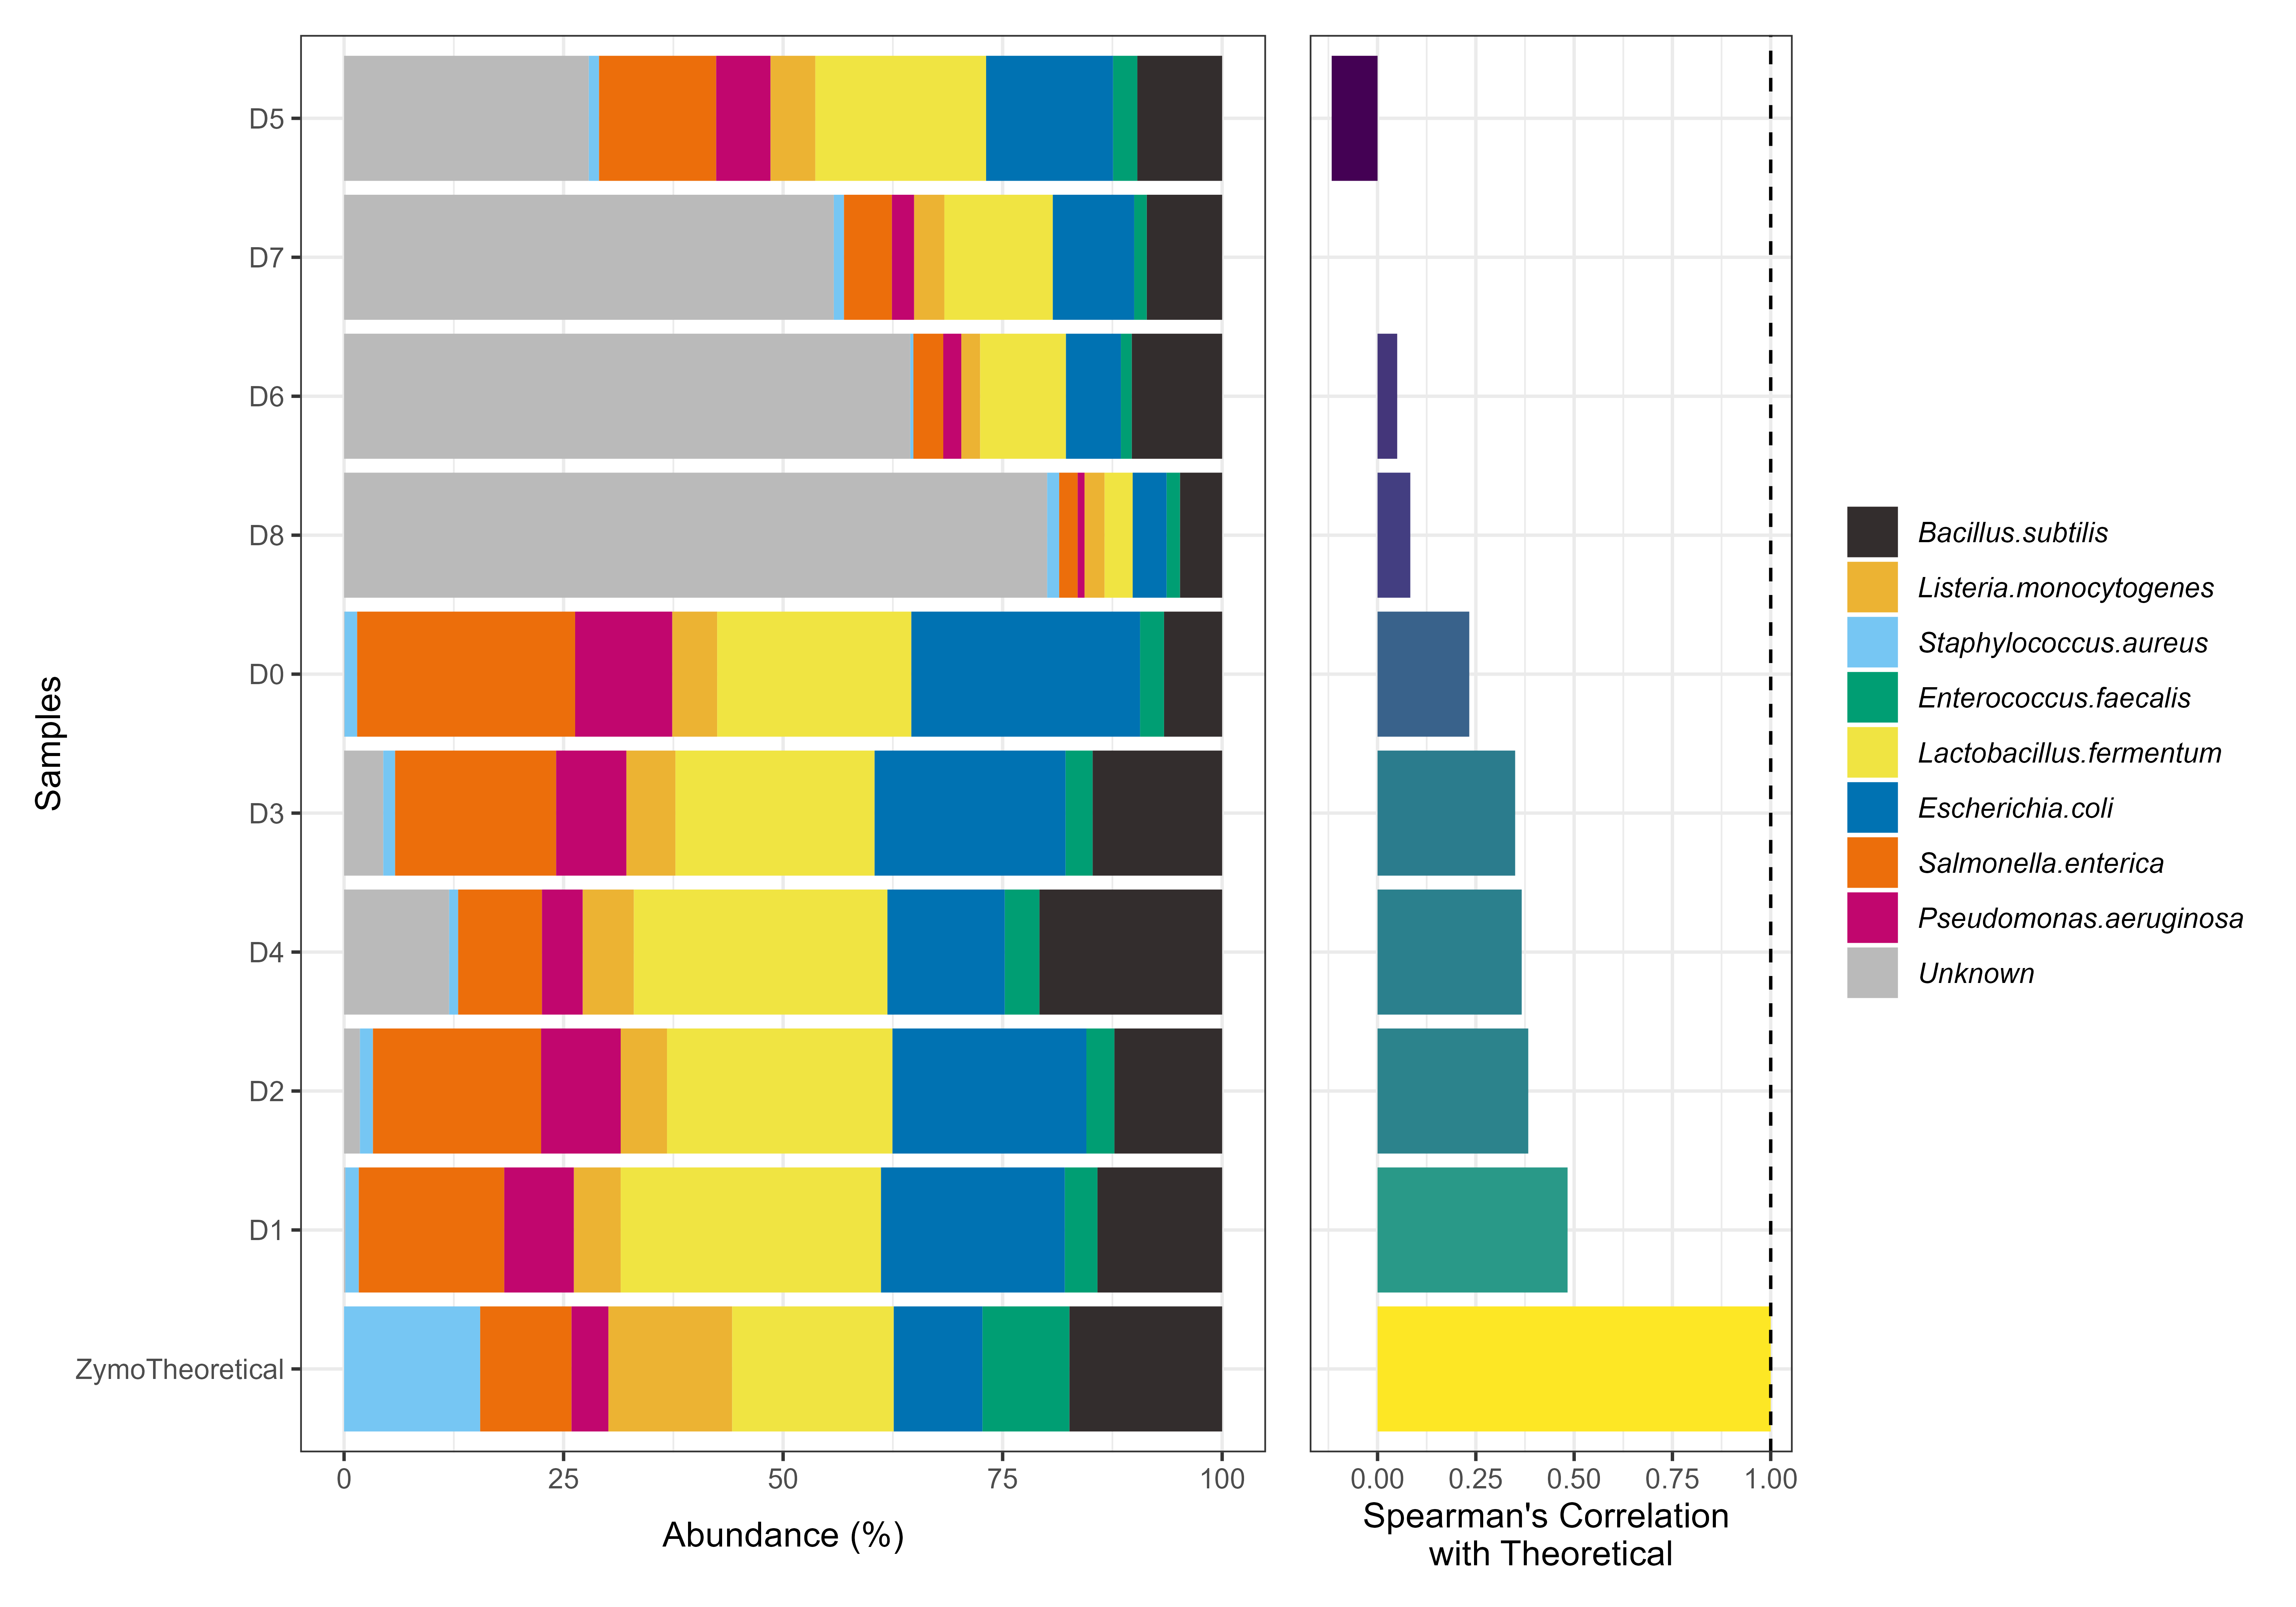
Plot ZymoBiomics to Experimental comparison
plotZymoDefault(x)Arguments
- x
Output from
checkZymoBiomics
Value
ggplot object
Details
A wrapper to plot the output of checkZymoBiomics.
Examples
library(phyloseq)
output.dat <- checkZymoBiomics(ZymoExamplePseq,
                               mock_db = ZymoTrainingSet,
                               multithread= 2,
                               threshold = 80,
                               strand = "top",
                               verbose = FALSE)
#> Using internal reference database
#>             for ZymoBiomics
#> Warning: Expected 8 pieces. Missing pieces filled with `NA` in 937 rows [9, 11, 12, 13, 14, 15, 16, 17, 18, 19, 20, 21, 22, 23, 24, 25, 26, 27, 28, 29, ...].
plotZymoDefault(output.dat)
